Understanding Box Turtle Travels and Route Maps
Even a brief glance at a turtle's annual travel route map can provide important information including such things as primary activity (home range) area size, travel distance, road crossings, etc. but there is much more information that might be gleaned if the tracking and mapping process is understood.
One person tracking every day can GPS approximately 1500 turtle locations during the season at this study area. But this number is not distributed equally among all the tracked turtles. Turtles that are close to the road and easily accessible, along a convenient tracking route, and those turtles that are considered most important may be located more often than those further away, or in rough terrain. Most turtles in this study area are located about every 2 or 3 days, but others may only get tracked every 5 days or so. Occasionally a turtle travels outside of radio range (from it's last known location), and either additional time is necessary to locate him, or time is taken away from tracking others to re-locate this "lost" turtle. "Lost" turtles must be located ASAP or risk being lost for the season or longer.
On a normal day, 7 to 12 turtles will be located and this GPS info will be uploaded to Mapsource and the new points added to each turtle's route map. This helps in planning the next day's tracking.
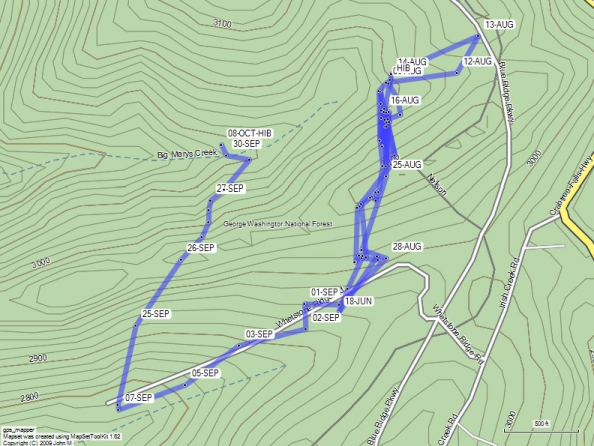
This 2014 Map of Turtle M4 shows the GPS locations (the black points) and route lines connecting the points. This map shows the 69 GPS locations tracked this season, and the 2.6 GPS mile track calculated by the computer.
It's important to note that the very long forray starting on August 8 and going through hibernation, included only 21 locations (and 20 soaking days) compared with 48 locations for the previous months.
The point is that turtles can cover long distances quickly between tracking locations, making the maps appear that they have spent much more than the actual amount of time in an area where long straight route lines are plotted. Only by utilizing GIS/GPS shapefiles, which contain date and time info, can accurate habitat use estimates (and Home Range) be obtained.
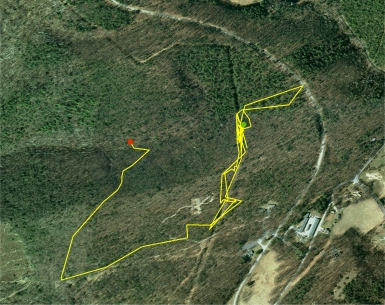
Here's the same M4 example on an aerial photo showing Emergence (green dot) and Hibernation (red dot) locations for 2014.
Turtle M4 returned to her primary activity area the following season and remained there until she was killed in 2020.
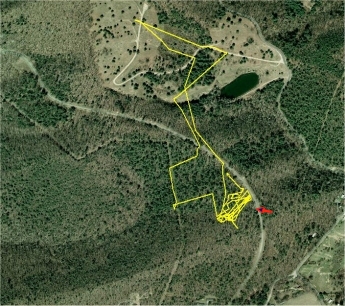
This is M9's route map from 2013. The red arrow shows a convenent parking spot beside the road. It's no wonder that there are a large number of tracking location points in M9's primary activity area.
The travel into the power line ROW and across the road into the meadow are long, difficult to track routes. M9 spent much less time here than in her primary activity area, but traveling faster, accumulates more map mileage.
For those trying to use GPS locations to calculate "Home Range", the lack of consistency in tracking long vs short travel routes seriously skews the results. Turtles need to be located consistantly, EVERY 2nd or 3rd day, rain or shine, emergence through hibernation, for many seasons.
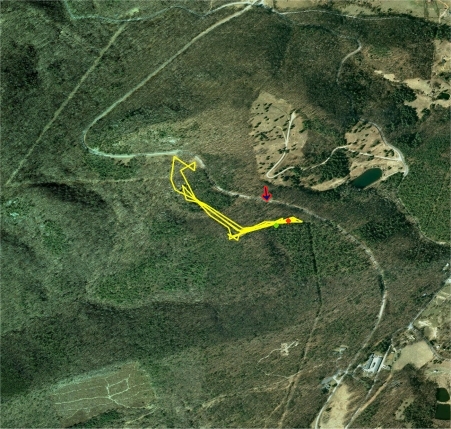
This is M21's 2015 travel map. The red arrow is the parking spot used for tracking in this area.
Most of M21's travel during the 2015 season was "on top" wiithin the ROW or it's edge. The long , mostly straight-line routes to the NW, are down a steep ROW slope into a sheltered drainage.
Thread-trailing M21, when he goes on the long downslope forrays, preserves his "actual" travel routes for GPS'ing during the the occassional tracking trips, as long as the thread doesn't run out.
Tracking M21 when he is on top is particularly easy and quick, but when he travels down slope into the adjacent drainage or further, the tracking is especially time and energy consuming, so consequently is tracked less often.
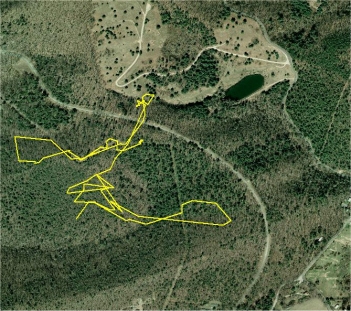
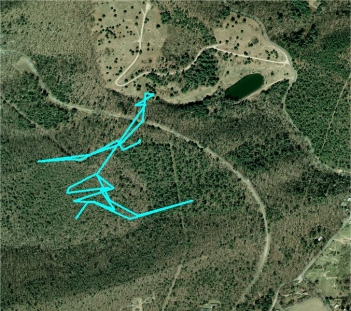
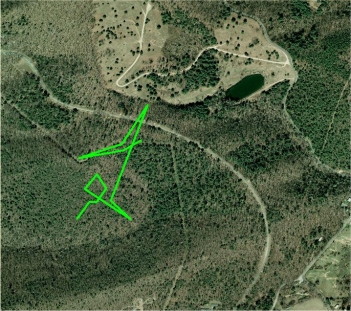
These 3 photo maps are of Turtle M1's 2013 tracked travels from emergence to hibernation.
The upper left is an as-tracked route of 87 GPS locations, 2.4 GPS miles.
The upper right is the route of the 33 GPS locations if tracked every 5 days, 1.7 miles.
The lower left map is the route of 14 GPS locations if tracked every 14 days, and is 0.9 GPS miles in length.
The calculation of a turtle's actual Primary Activity Area (Home Range) is largely dependant on the quality and consistency of the season's tracking activity, and ultimately, multi-season tracking activity.
What M1's actual traveled route looked like is unknown, since she was not tracked daily, but having the benefit of thread-trailing her many seasons in the past, the estimated travel distance for this season might be well over 4 miles.
Everything here is still under construction
Turtle Tracking Precision
Terrapene carolina carolina
A Relict Population Doomed To Extinction?